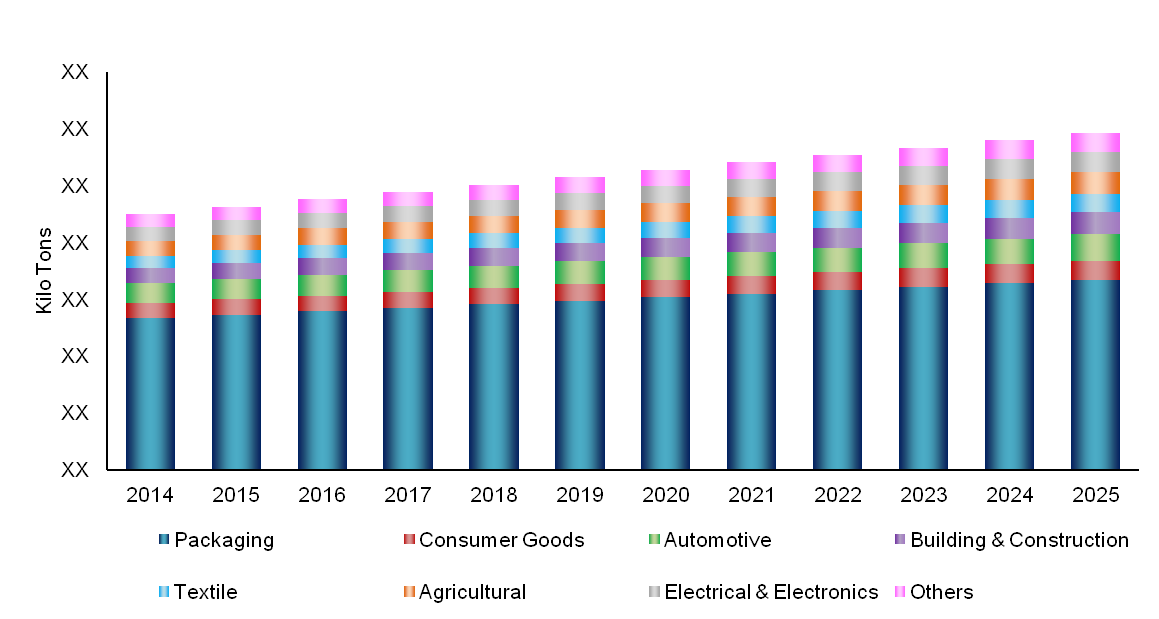
North America (USA) is one of the largest producers of biodegradable polymer PLA and is the leading exporter of PLA as well. NatureWork operates a 150 kiloton plant at its Nebraska facility. This plant is one of the most important PLA plant as it supplies to other major countries of the world. The regional biodegradable plastics demand is anticipated to increase by a CAGR of 9.2% in the forecasted years till 2025.
In terms of demand by applications, packaging accounts for around 62.4% share and this will continue to be the largest application during the forecast period till 2025. It is forecast to grow at an annual average of 6.0% per year. The second largest application is consumer goods at 12.9% share followed by agricultural at 9.8% and textiles at 4.4%while all other applications together account for a share of around 10.5% of the total regional biodegradable plastics demand. Further, the market share of each of these applications were estimated to be between 1% to 3.0% each.
Most of the demand for biodegradable plastics in the region is expected to be from packaging applications owing to high demand, while the largest biodegradable plastic is PLA and it roughly accounts for around 52.2% of the total biodegradable plastic demand. The USA accounts for almost 93% of the North American biodegradable plastics demand while Mexico accounts for a share of around 1.9%. Similarly, Canada accounts for the remaining 5.3% of the regional demand. Mexico is expected to be the fastest growing country in the region with a CAGR of 26.3% in the forecast period owing to a very low base.
TABLE 1 North America Biodegradable Plastics Demand, By Application, USD million (2015-2025)
| Applications (USD Million) | 2015 | 2016 | 2017 | 2018 | 2019 | 2025 | CAGR (2019-2025) |
| Packaging | 158.2 | 164.9 | 168.0 | 168.0 | 172.9 | 208.0 | 3.1% |
| Consumer Goods | 40.8 | 44.5 | 47.5 | 49.8 | 53.8 | 87.4 | 8.4% |
| Automotive | 6.0 | 6.8 | 7.5 | 8.1 | 9.1 | 17.3 | 11.4% |
| Building & Construction | 6.1 | 6.9 | 7.7 | 8.5 | 9.5 | 19.0 | 12.2% |
| Textile | 9.4 | 10.9 | 12.3 | 13.6 | 15.4 | 32.0 | 12.9% |
| Agricultural | 17.1 | 19.7 | 22.1 | 24.3 | 27.4 | 55.5 | 12.5% |
| Electrical & Electronics | 2.1 | 3.0 | 3.8 | 4.7 | 5.9 | 16.2 | 18.5% |
| Others | 9.8 | 13.8 | 17.9 | 22.0 | 27.3 | 75.4 | 18.5% |
| Total | 249.4 | 270.3 | 286.9 | 299.0 | 321.3 | 510.8 | 8.0% |

